 |
|
|
NASA EM31 Project diagram
North Pole Expedition 2003
|
NASA EM31 Project diagramNorth Pole Expedition 2003 |
||
|
|
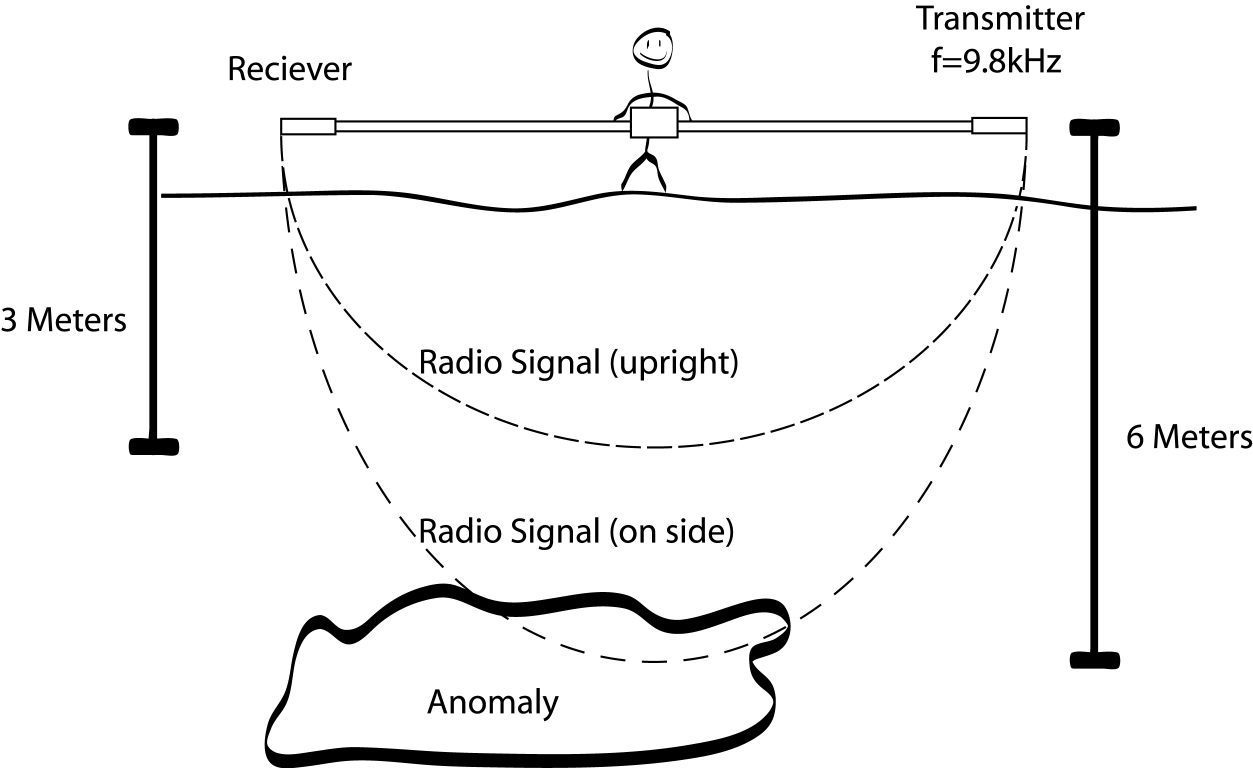
This is a operational diagram of the NASA EM31 surface conductivity tester used for measuring ice thickness. April 2003 |
| North Pole Expedition 2003 |
|
|
|
|
Please Note: The background on this page is an aerial photo of the sea ice near the island of Svalbard, Norway
|
|
|
|
|
|
|
|
| This drawing was made by Daniel one
of the students that was involved in the operation and testing of the EM-31.
At the right end of the EM-31 tube is a 9.8 Khz transmitter. On the
other end of the EM-31 Probe is a receiver also set for 9.8 Khz.
The receiver actually receives two signals, one which originates in the
transmitter and travels down the tube (the reference signal) and another
signal which travels out of the EM-31 transmitter, down through the ice
and back to the receiver (The variable receiver input) Here the phases
of the two signals, the reference and the variable, are compared to give
a result.
The result, in it's own only shows the conductivity of the ice being tested, however, until actual, physical, holes have been drilled into the ice and a physical measurement is made, the conductivity reading is useless. Once the physical holes are drilled and the measurements are made, these results are fed into the EM-31 as calibration data. Now the thickness of the ice can be actually measured with the EM-31 using the ice conductivity as a constant. The drawing above shows the EM-31 measuring
an anomaly below the surface. In the case of making measurements
on the ice, the 9.8 Khz signal gets reflected off of the bottom surface
of the ice. The interface of the Ice subsurface and the top of the
salten sea is the anomaly that reflects the transmitters signal.
Therefore, measuring the phase difference between the reference signal
and the received signal gives us the thickness of the ice.
|
|
| . |
|
| ||
|
![]()
![]()
/North_Pole_2003/NASA-North_Pole_2.html|62547"
| . |